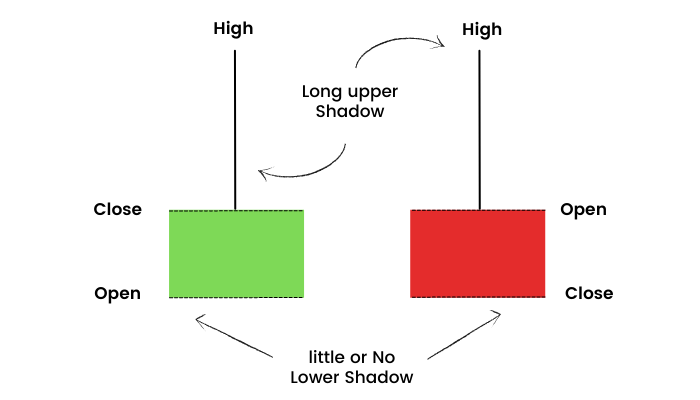
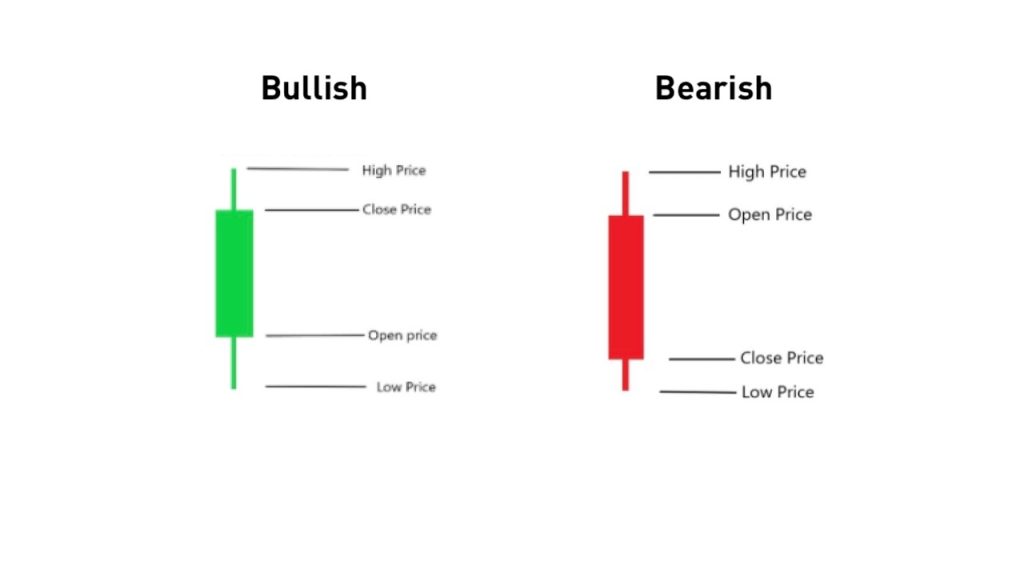
A Candlestick Pattern represents a market’s opening, high, low, and closing (OHLC) prices. The rectangular real body, or just body, is colored with a dark color (red or green) for a drop in price and a light color (green or white) for a price increase. The lines above and below the body are referred to as wicks or tails, and they represent the day’s maximum high and low. Taken together, the parts of the candlestick can frequently signal changes in a market’s direction or highlight significant potential moves that frequently must be confirmed by the next day’s candle.
There are lots of candle but here you will knowing some of common and powerful candlestick patters
Doji Candlestick Pattern
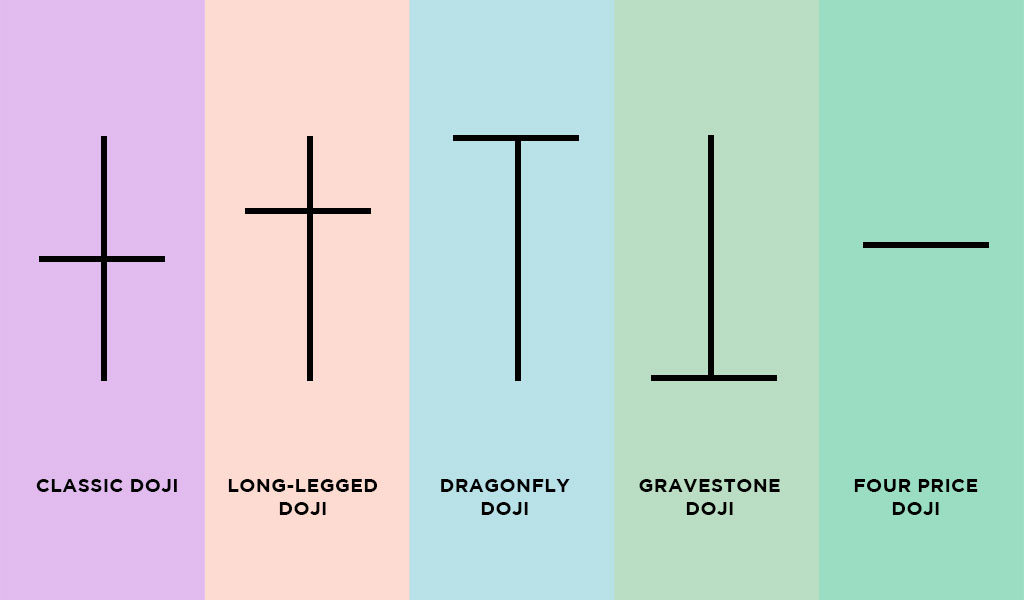
A doji candle is a candlestick pattern that signals indecision in the market. It is formed when the opening and closing price of a security is almost the same, resulting in a candle with long wicks on both the upper and lower end. The long wicks show that both buyers and sellers have attempted to push the price in opposite directions, but neither side was able to gain control. This results in a candle with a small real body that is often situated near the middle of the candle’s high and low range.
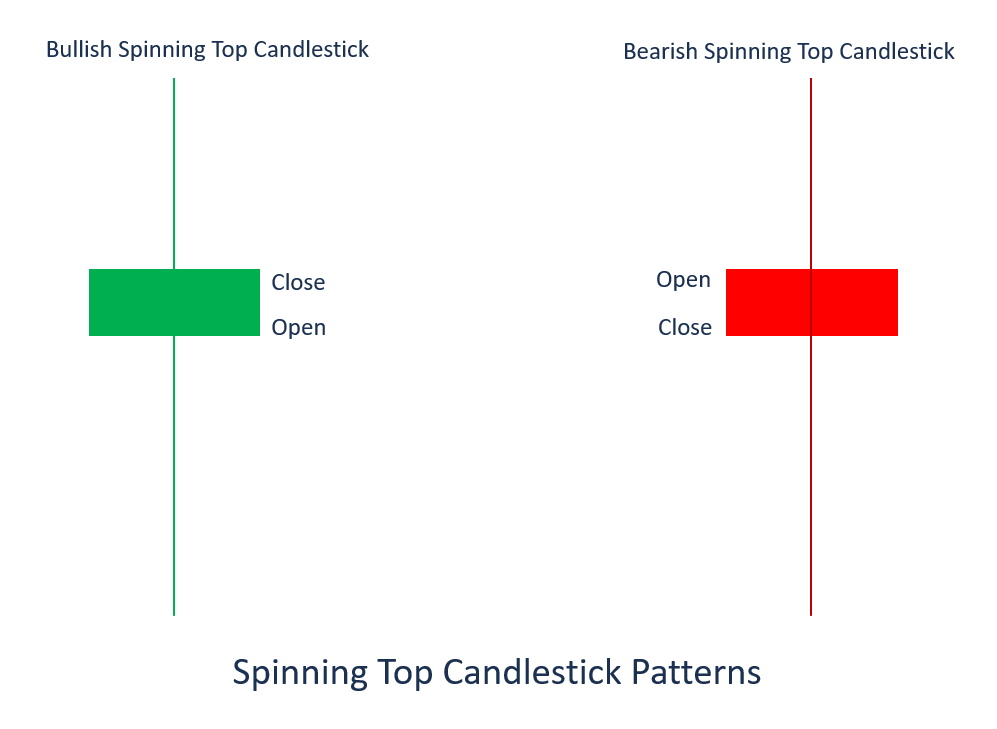
Spinning Top Candlestick Pattern?
A spinning top candle is a similar pattern to the doji candle, but it is formed when the real body of the candle is larger and the upper and lower wicks are still relatively long. The spinning top candle also signals indecision in the market, as the larger real body shows that both buyers and sellers have taken control of the price at some point during the trading session, but neither side was able to gain a sustained advantage.
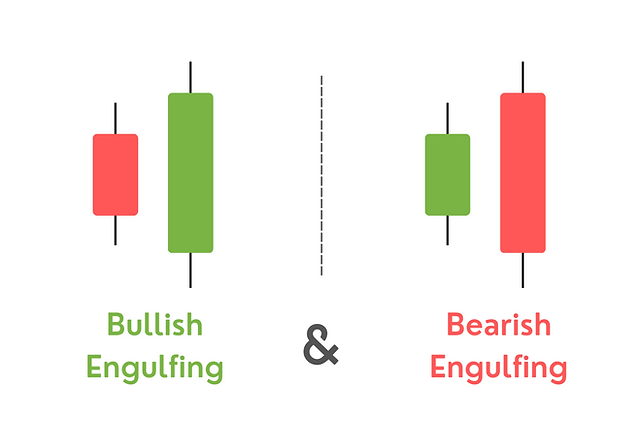
Bullish/Bearish Engulfing Candlestick Pattern
An engulfing line is a strong indicator of a directional change. A bearish engulfing line is a reversal pattern after an uptrend. The key is that the second candle’s body “engulfs” the prior day’s body in the opposite direction. This suggests that, in the case of an uptrend, the buyers had a brief attempt higher but finished the day well below the close of the prior candle. This suggests that the uptrend is stalling and has begun to reverse lower. Also, note the prior two days’ candles, which showed a double top, or a tweezers top, itself a reversal pattern.
A bullish engulfing line is the corollary pattern to a bearish engulfing line, and it appears after a downtrend. Also, a double bottom, or tweezers bottom, is the corollary formation that suggests a downtrend may be ending and set to reverse higher.
4.Hammer Candlestick Pattern
A hammer suggests that a down move is ending (hammering out a bottom). Note the long lower tail, which indicates that sellers made another attempt lower, but were rebuffed and the price erased most or all of the losses on the day. The important interpretation is that this is the first time buyers have surfaced in strength in the current down move, which is suggestive of a change in directional sentiment. The pattern is confirmed by a bullish candle the next day.
